Scaling RAG Systems in Financial Organizations Artificial intelligence has emerged...
Read MoreCustomer Churn Prediction Using papAI:
The Key to Sustainable Growth in the Telecom Industry
Table of Contents
ToggleThe loss of customers is a severe issue for telecom companies. It can result in decreased profits, more expenses, and a loss of market share. In reality, the typical telecom business loses 15% of its clients annually. This may be an expensive issue because it might be expensive to attract new clients. Customer churn may be caused by various reasons, such as price, service quality, and customer happiness. etc.
Telecommunications companies may identify customers who are at risk of churning and take precautions by using AI-powered customer churn prediction. This might result in huge financial savings and long-term expansion for the telecom sector.
Find out how papAI can improve the deployment of AI projects in Sales & Marketing.

A McKinsey study found that telecom businesses using AI predictive analytics had cut loss of customers by 15% to 20%.In this article, we look at the role that papAI may play in customer churn prediction.
The Telecom Industry's Overview of AI
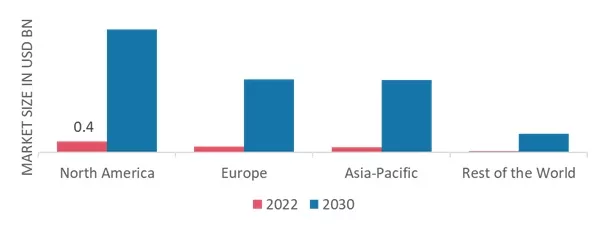
The global AI in telecommunication market size was valued at $1.2 billion in 2022 and is projected to reach $38.8 billion by 2031, growing at a CAGR of 41.4% from 2022 to 2031. This growth is being driven by the increasing adoption of AI by telecom companies to improve their operations and customer experience.
In the telecom sector, AI is employed in a number of applications, including:
– Customer churn prediction: Telecom businesses may prevent customer churn by using AI to identify the customers who are most likely to leave.
– AI may be used to optimize telecom networks to increase their effectiveness and performance.
– Fraud detection: Artificial intelligence (AI) may be used to spot dishonest behavior like SIM swapping and phone number porting.
– Marketing that is more personalized can increase client engagement. AI can be utilized to do this.
– AI may be used to construct virtual assistants that can assist customers and offer answers to their inquiries.

Telecom AI from a Regional Perspective
Thanks to the region’s booming technology and communications industry, which is anticipated to drive the telecom AI market over the forecast period, North America topped the worldwide telecom AI market in 2022 with a valuation of around $0.4 billion. However, because of its expanding digital capabilities and fiercely competitive sector, Asia Pacific is predicted to have significant expansion throughout the projection period. In the next years, this is anticipated to fuel the region’s AI market’s expansion.
Here are some of the reasons why North America is expected to dominate the global telecom AI market in the forecast period:
- The region has a strong foundation in the telecom sector, with leading companies such as AT&T, Verizon, and T-Mobile.
- North America is also a major hub for technology innovation, with companies such as Google, Microsoft, and IBM developing cutting-edge AI solutions.
- The region has a large and affluent customer base that is willing to adopt new technologies.
Here are some of the reasons why Asia Pacific is expected to witness considerable development in the telecom AI market in the forecast period:
- The region is home to a large and growing population with increasing disposable incomes.
- Asia Pacific is also a major hub for manufacturing and IT, which is driving the demand for telecom services.
- The region is also home to a number of emerging economies, such as China and India, which are investing heavily in telecom infrastructure and AI.
Customer Churn in the Telecom Industry: What Does It Mean?
Customer churn in the telecom industry refers to the frequency at which consumers cancel their subscriptions or change to a different service provider. Many factors can contribute to it, including dissatisfaction with the service, issues with the network’s quality, a lack of individualized services, or the availability of cheaper pricing from competitors. Customer churn is a big problem for telecom firms since it may result in lost sales, a drop in market share, and reputational harm. The long-term success and survival of telecom businesses depend on their ability to recognize and control client turnover.
Here are some instances of how telecom firms may be impacted by customer churn:
- Sales that were lost: When consumers leave, they take their money with them. The telecom business may lose sales and income as a result of this. For instance, a telecom business may lose $100 million in income if it loses 10% of its subscribers in a year.
- Market share decline: The telecom company’s market share will decrease as consumers leave. Due to this, the business may find it challenging to compete with its rivals. For instance, if a telecom company’s market share falls from 20% to 15%, it would need to exert more effort to win over new clients and keep hold of current ones.
- Recognize the causes of customer turnover: In order to solve the issue, telecom businesses must recognize the causes of customer churn. This may be achieved by conducting customer surveys, reviewing customer data, and speaking with dissatisfied clients.
- Implement customer churn prevention strategies: Telecom businesses may use a variety of tactics to keep customers from leaving, including discounts, better customer support, and individualized services.
Leading the data revolution: CDO role in today's organizations
The need for CDOs is expanding as a result of the growing significance of data in today’s corporate environment. Any organization’s success depends on the CDO, who is the primary force behind digital innovation and change.

Case Study: How Can papAI Solution Improve Customer Churn Prediction?
For the purpose of our analysis, we used a Teleco dataset representing different churn data from telco customers.
The data set includes information about:
– Customers who left within the last month – the column is called Churn.
– Services that each customer has signed up for – phone, multiple lines, internet, online security, online backup, device protection, tech support, and streaming TV and movies.
– Customer account information – how long they’ve been a customer, contract, payment method, paperless billing, monthly charges, and total charges.
– Demographic info about customers – gender, age range, and if they have partners and dependents.
The Model We Will Use
Survival analysis, a potent statistical method, provides a comprehensive framework for investigating customer attrition in a range of industries, including telephony. In contrast to conventional research methods, which focus on static outcomes, survival analysis enables us to study the period until an occurrence of interest, such as the churn of telecom consumers.
By examining survival curves, risk rates, and related statistical models, we are able to gain a better understanding of the circumstances and elements that lead to client loss. Businesses will be able to strengthen retention tactics, proactively identify and handle churn, and ultimately increase customer happiness and profitability.
The Analysis's papAI Strengths
Using papAI survival models ML problem on the tenure (a customer’s length of subscription retention) in the telecom churn dataset.
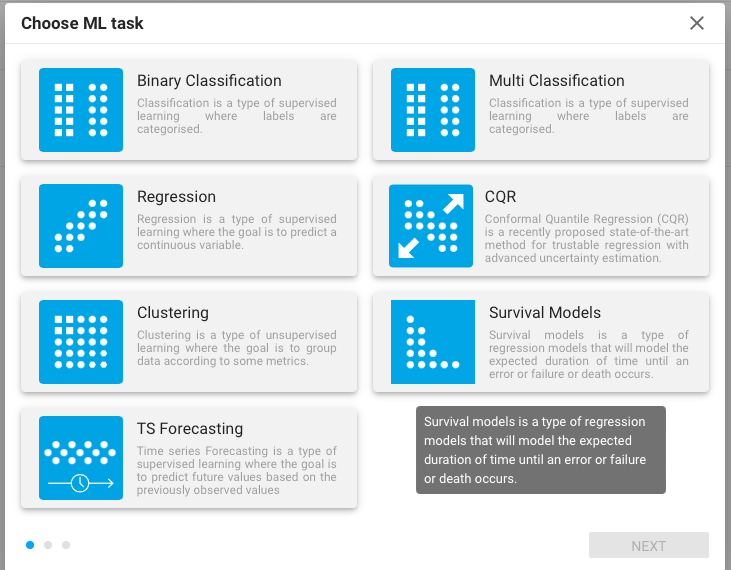
We gain insights into how different factors affect the timing and likelihood of customer churn.
Hazard Ratio
The hazard ratio (HR) is a measure of the relative risk associated with a specific covariate in the Cox proportional hazards model. It quantifies the change in the hazard rate (risk of an event) between two groups, typically defined by different levels of a covariate
Features Coefficient
The hazard ratio (HR) and each covariate utilised in the model are compared using this graphic. If HR is more than 1, the covariate is a risk factor; if HR is less than 1, the covariate is protective; and if HR is equal to 1, the covariate has no impact on survival.

This box plot enables us to clearly see the effect of each feature on survival (churn).
Different Features Effects on Churn (Feature Selection)
We use the survival function plot to check the effect of different features on churn. The x axis represents the months a customer kept his subscription, and the y axis the probability that the customer keeps his subscription.
Contract:
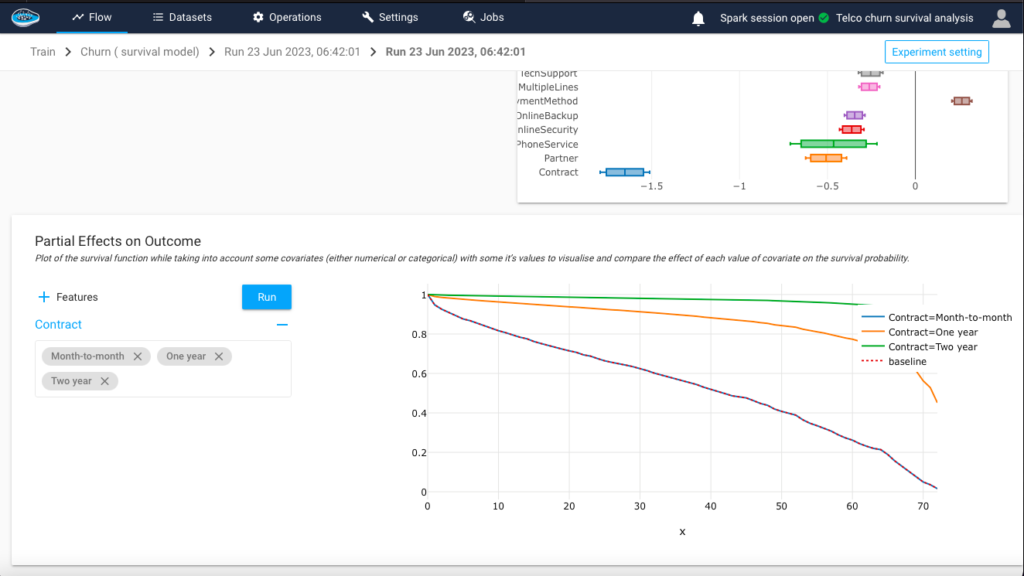
Upon analyzing the data, it is evident that customers with long-term contracts exhibit a higher likelihood of remaining with the company. This finding suggests that the contract duration plays a significant role in customer retention.
Phone Service:

We notice that a user with no phone service is more likely to quit his subscription.
Partner:
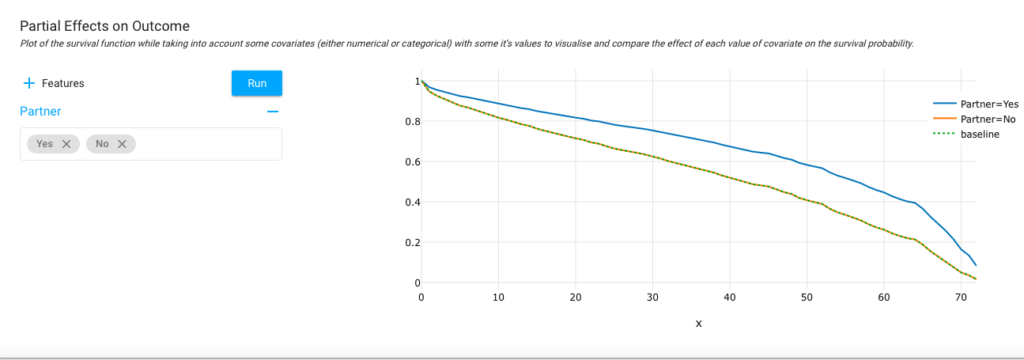
We can also notice that a user who has a partner is more likely to stay longer with the company.
Gender:
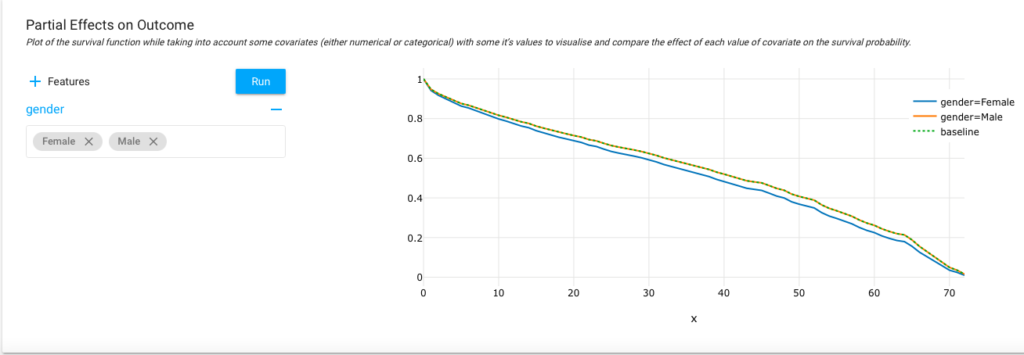
Based on the analysis conducted, it appears that there is no significant difference between the two genders in their tendency to churn. The churn rates for both genders appear to be similar, suggesting that gender alone may not be a strong predictor of churn in this telco dataset.
Payment method:
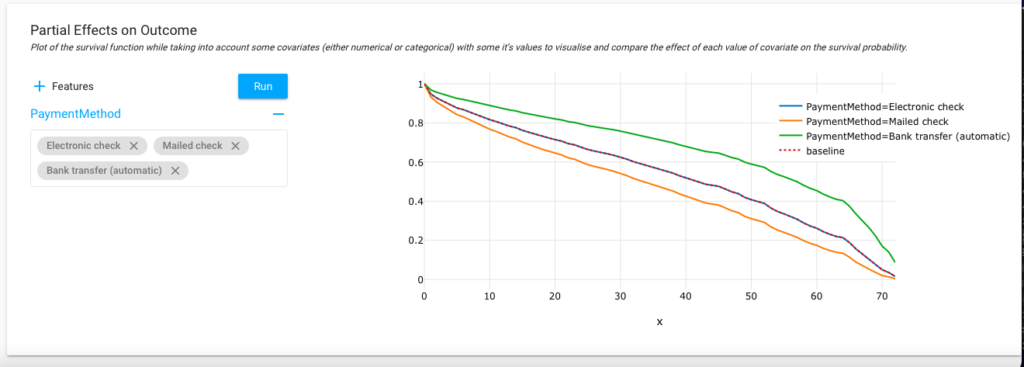
Additionally, we can see that clients who choose automatic bank transfer payments for their subscriptions are more likely to continue using such services than those who use more conventional payment options. This issue may be explained by consumers’ propensity to ignore automated subscriptions, which results in ongoing payments without routine review.
Metrics
Metrics are an important measure of an ML model performance , papAi offers various metrics concerning each run of the ML model, for our specific run using Cox Proportional Hazard algorithm, we have 3 of them :
Aic (Akaike’s Information Criterion): Rewards goodness of fit used for comparing models , models with the lower AIC value is considered a better fit to the data.
Concordance index: It assesses the concordance or agreement between the predicted survival times and the actual observed survival times of individuals in a dataset.
A C-index of 0.5 indicates a model that performs no better than random chance, while a C-index of 1.0 represents a perfect predictive model. Generally, a C-index above 0.7 is considered acceptable, and higher values indicate better predictive accuracy.
Log-likelihood ratio test: The log-likelihood ratio test provides a formal statistical framework to evaluate the significance of including or excluding covariates in survival analysis models and helps in model selection and refinement

Build Your Own AI-based Tool using papAI Solution to Improve the Accuracy of Customer Churn Prediction Projects
papAI Solution has played a pivotal role in enabling us to conduct a comprehensive churn analysis in the telecom industry. By leveraging the platform’s capabilities, we were able to explore and analyze large volumes of customer data efficiently and effectively.
The platform provided us with the necessary tools to preprocess, visualize, and model the data, allowing us to uncover valuable insights into customer churn dynamics. Additionally, the platform’s integration with survival analysis techniques, such as the Cox proportional hazards model, empowered us to delve deeper into the timing and drivers of churn, considering the time-to-event nature of the data. This enabled us to identify significant predictors of churn and understand their impact on customer retention.
The flexibility, scalability, and robustness of our data analysis platform have facilitated a comprehensive understanding of telco churn, empowering businesses to make data-driven decisions, improve customer retention strategies, and ultimately drive growth and success in the competitive telecommunications landscape.
Want to find out more about the functionalities of papAI Solution? book your demo now. Our team of AI experts can help you create a customized AI-based tool that meets the unique needs of your organization.
Interested in discovering papAI?
Our commercial team is at your disposal for any questions
How AgenticAI is Transforming Sales and Marketing Strategies
How AgenticAI is Transforming Sales and Marketing Strategies Agentic AI...
Read More“DATATEGY EARLY CAREERS PROGRAM” With Abdelmoumen ATMANI
“DATATEGY EARLY CAREERS PROGRAM” With Abdelmoumen ATMANI Hello, my name...
Read MoreIntroducing the Error Analysis Tree: A Smarter Way to Improve AI Models
Introducing the Error Analysis Tree: A Smarter Way to Improve...
Read More


