
How Law Firms Use RAG to Boost Legal Research RAG...
Read More

How RAG Systems Improve Public Sector Management
How RAG Systems Improve Public Sector Management The most important...
Read More
Scaling RAG Systems in Financial Organizations
Scaling RAG Systems in Financial Organizations Artificial intelligence has emerged...
Read More
How AgenticAI is Transforming Sales and Marketing Strategies
How AgenticAI is Transforming Sales and Marketing Strategies Agentic AI...
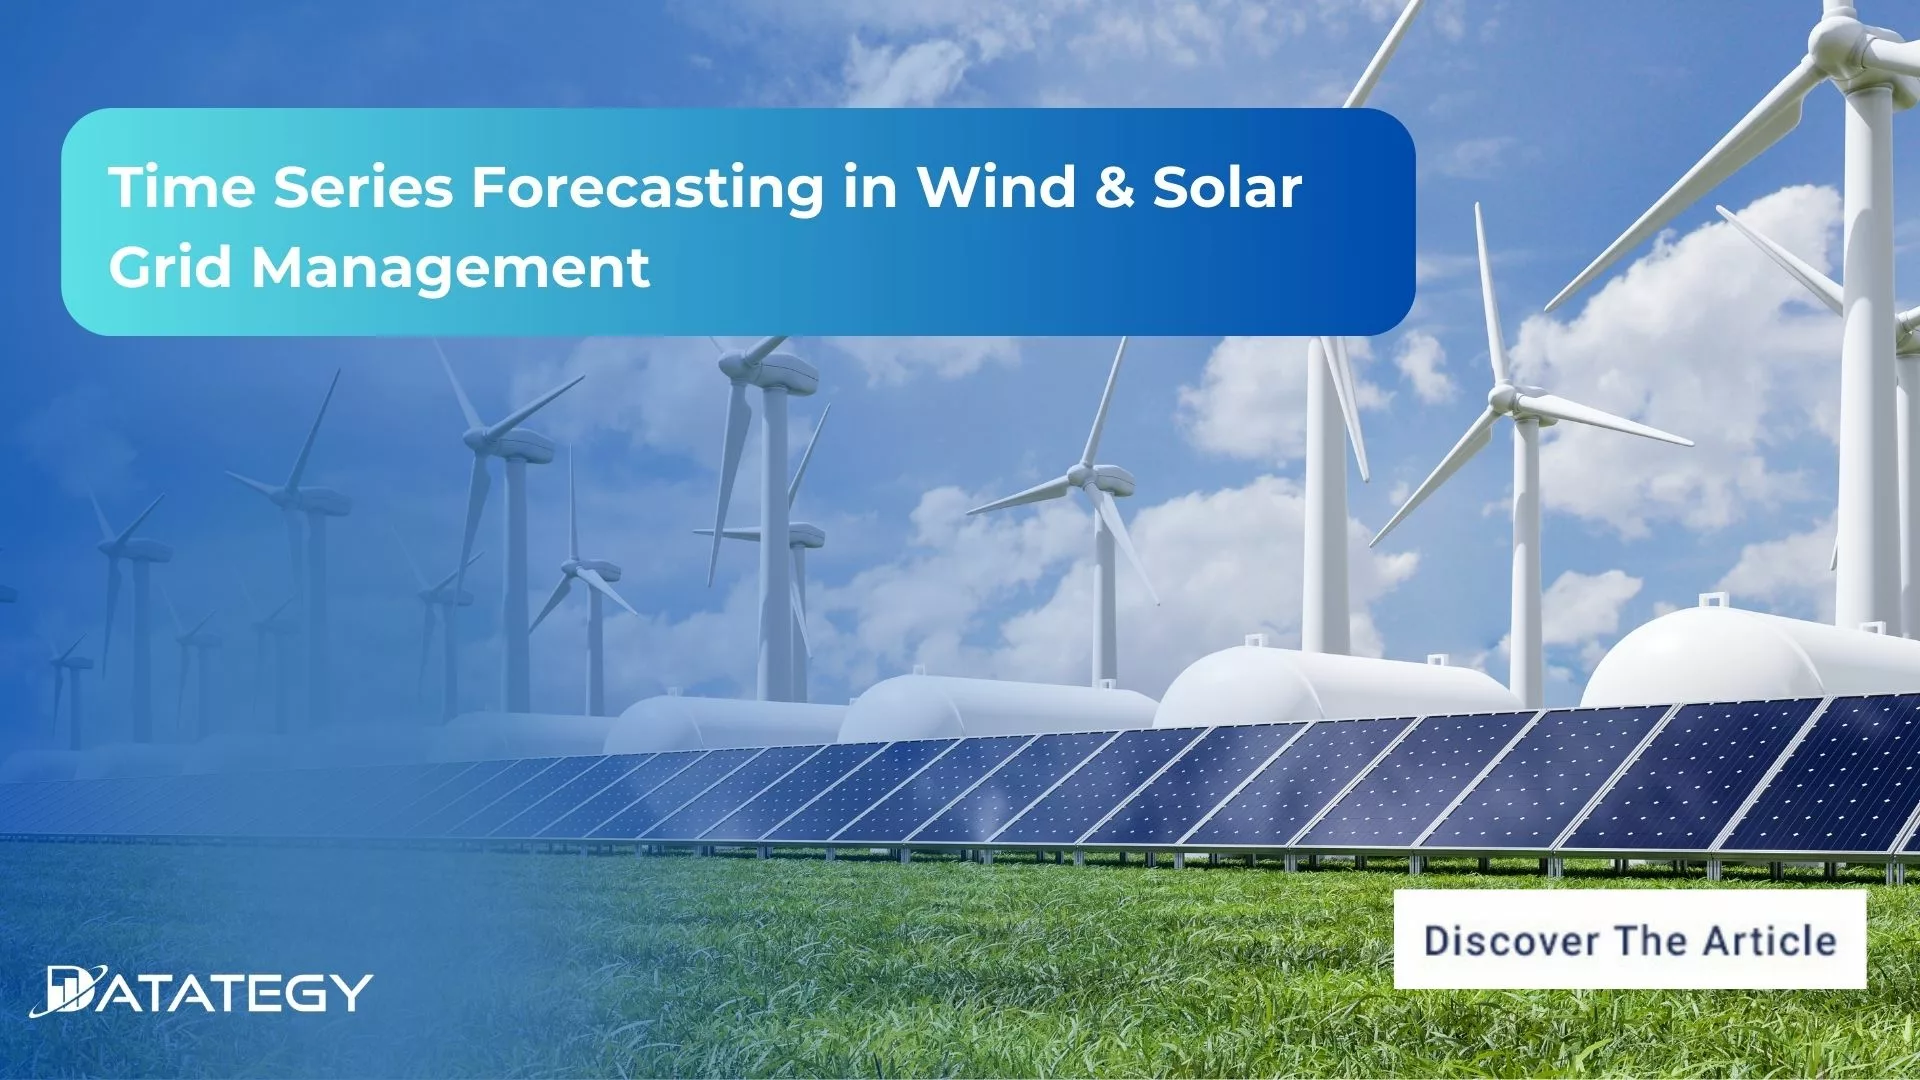
Read MoreTime Series Forecasting in Wind & Solar Grid Management
Summary
Article Name
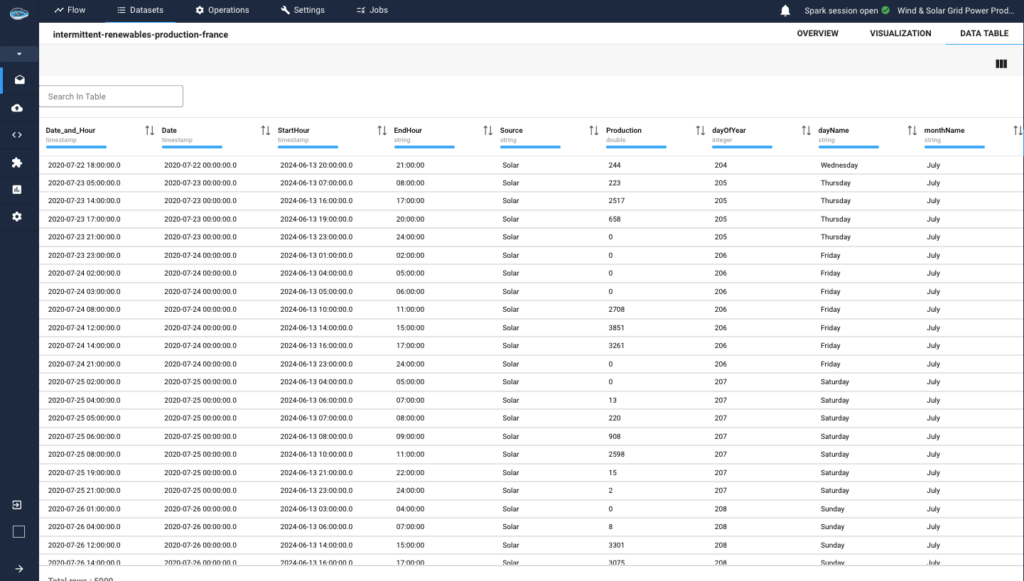
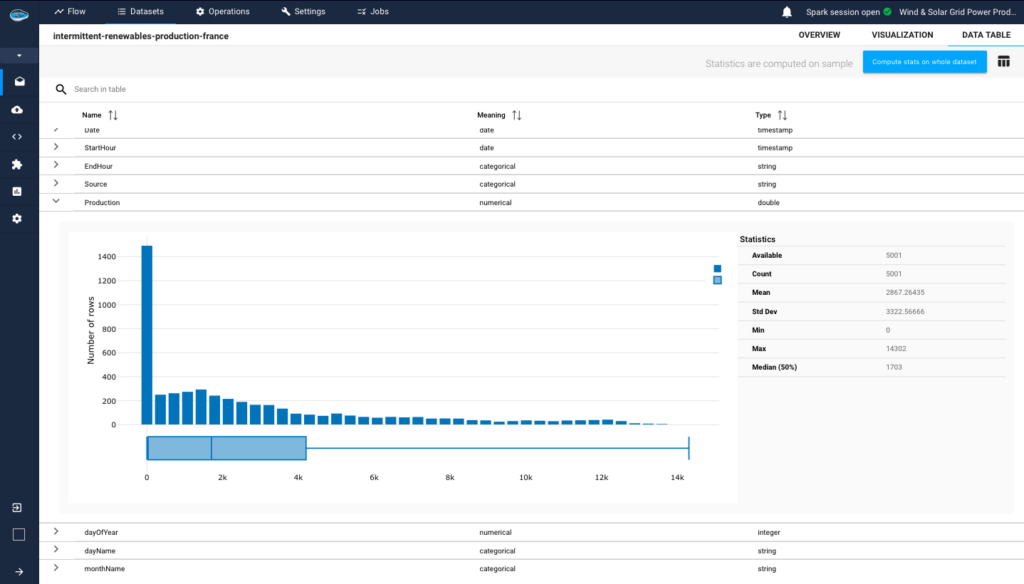
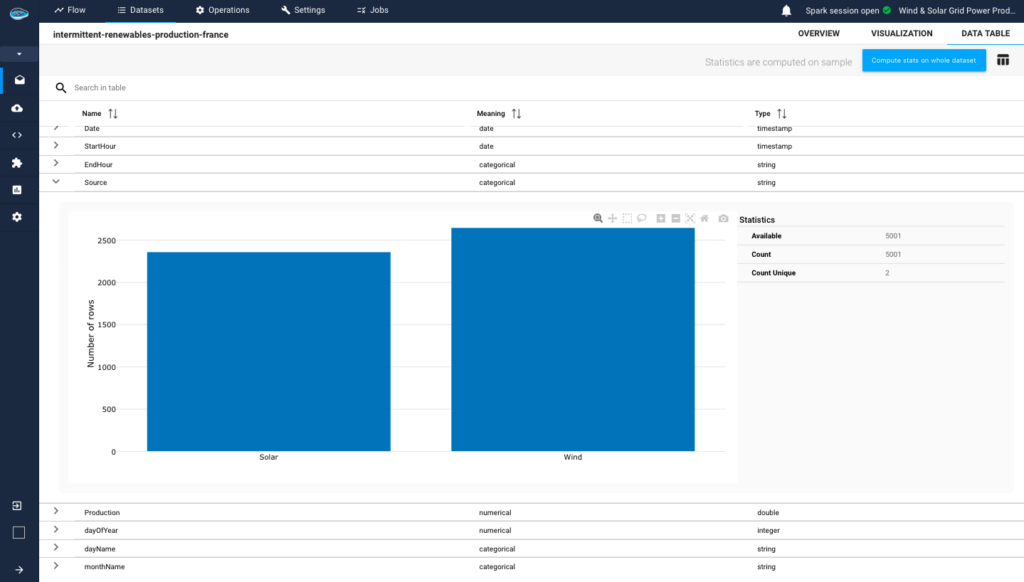
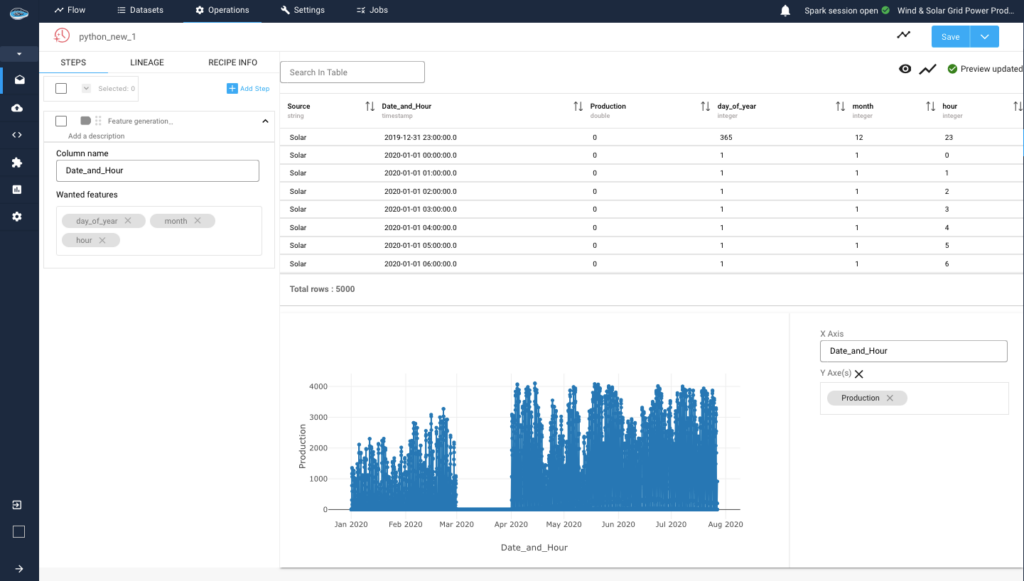
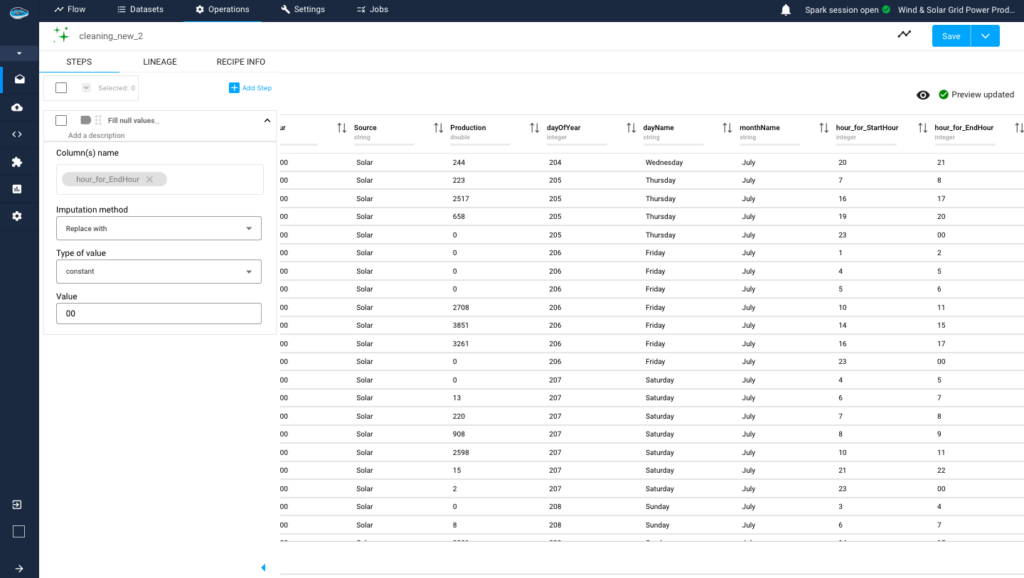
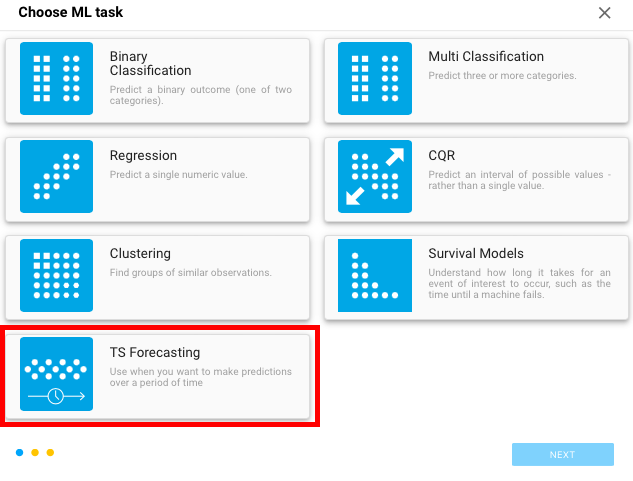
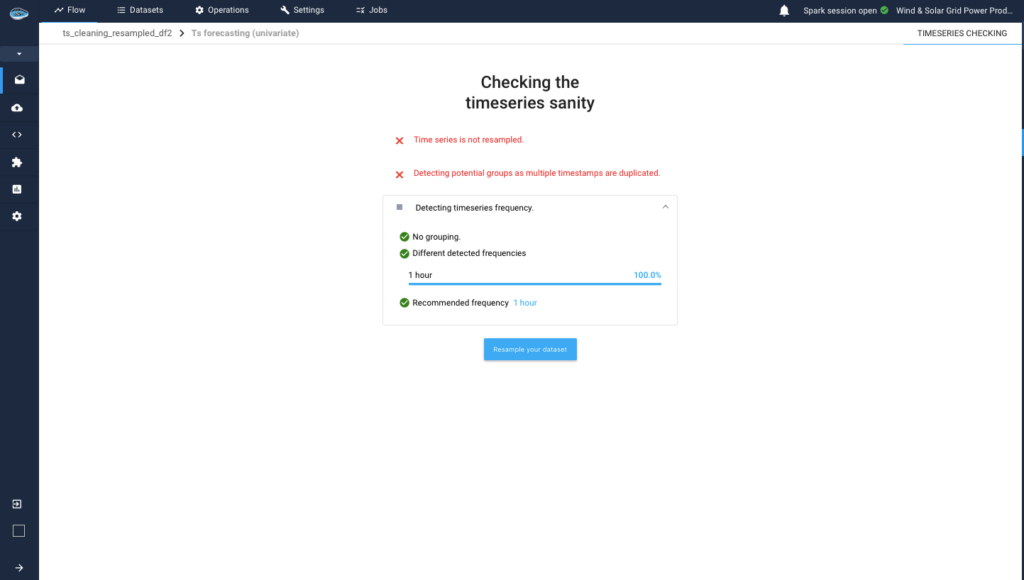
Time Series Forecasting in Wind & Solar Grid Management
Description
Discover how time series forecasting enhances wind & solar power production, ensuring reliable and efficient integration into the energy grid.
Author
hocine ousmer
Publisher Name
Datategy
Publisher Logo