
How Law Firms Use RAG to Boost Legal Research RAG...
Read MoreHow Do AI Predictive Models Estimate Car Prices?
Table of Contents
ToggleValuation methods have evolved over the last ten years from traditional data analysis to a modern proactive approach using artificial intelligence. They are used in various fields, from retail to finance to insurance.
AI can incorporate a wider range of factors into valuations, including market sentiment and economic forecasts. This provides a more complete picture of a company’s true value. A study by PwC showed AI can improve data accuracy by up to 80%. This translates to potentially more precise valuations.
Find out how papAI can improve the deployment of AI projects in Sales Teams.
This article explains what AI predictive models are and explores their benefits for organizations.
Modern Valuation Methods and the Role of AI
Modern valuation techniques are being revolutionised by artificial intelligence (AI), which brings efficiency and accuracy to a variety of industries. When it comes to estimating the price of cars, artificial intelligence (AI) uses large datasets and complex algorithms to examine a variety of factors that affect a vehicle’s worth.
Age, mileage, make and model, market trends, and even seemingly insignificant details like colour and feature sets are some of these variables. Artificial intelligence models are able to process this data at a rate of knots, which allows them to produce price predictions that are far more accurate than those produced by hand.
The capacity of AI to continuously learn and adapt is one of the main benefits of using it in valuation. A subset of AI called machine learning algorithms gets better with time the more data they are exposed to.
This implies that as market conditions and emerging trends change, AI models continue to improve in accuracy. For instance, AI can swiftly modify its valuations to account for changes in the automotive market’s economic conditions or the rising popularity of a particular car model, thereby guaranteeing that the estimates stay accurate and pertinent.
What Are Predictive Models?
With the use of historical data, predictive models are effective tools for projecting future results. Fundamentally, these models use historical data’s patterns and relationships to infer plausible future outcomes. Predictive models offer insights into potential future scenarios, which assist businesses and individuals in making informed decisions. These insights can be applied to a variety of domains, including weather patterns, stock prices, and customer behaviour.
Predictive models must be created and used using a number of processes, including data cleaning, model training, validation, and collection. The accuracy of the model is greatly influenced by the quality and quantity of data, so data collection is essential. After the data is ready, it is used to train the model, which entails teaching it to identify relationships and patterns.
Key Algorithms:
Linear Regression:
Of all the predictive modeling algorithms, linear regression is one of the most simple and efficient. It assists in determining the relationship between two variables by locating the best-fit line through a collection of data points. For example, using linear regression to determine how much an automobile will cost based on its mileage will show you how those factors affect price. For the purpose of comprehending fundamental trends and formulating simple predictions, this algorithm assumes a linear relationship and yields a comprehensible model.
Decision Trees and Random Forests:
Decision trees are simple models that, like diagrams, divide data into branches according to specific criteria. A final prediction is made at the leaves after each branch represents a decision based on an attribute. In the context of estimating car prices, for instance, a decision tree might divide cars according to age, then mileage, and so forth. This idea is expanded upon by random forests, which lower the possibility of overfitting and increase accuracy by building multiple decision trees and averaging their predictions. Managing complicated datasets with lots of variables is made robust with this ensemble method.
Neural Networks and Deep Learning:
These models are especially effective at identifying complex, non-linear relationships in big datasets. Multiple hidden layers in deep learning, a subset of neural networks, enable the model to automatically pick up complex patterns and features. This makes it incredibly efficient for tasks like natural language processing, image recognition, and, in our case, accurately predicting car prices by taking into account multiple factors at once. Deep learning models are highly versatile and powerful, which makes them ideal for even the most difficult predictive tasks.
What are the benefits of Predictive AI in Car price estimation?
Improved Precision:
As AI prediction models can analyze large volumes of data in a manner that humans just cannot, they significantly enhance the estimation of automobile costs. Conventional appraisal techniques often use a small set of information, such the car’s age, manufacture, and model. AI models, on the other hand, take into account a wide range of additional variables, such as the car’s mileage, condition, and particular amenities (such as the leather seats or sunroof), as well as market trends.
AI can forecast automobile prices far more accurately than conventional techniques by evaluating all of this data. For instance, AI can swiftly modify its forecasts to account for an unexpected spike in demand for electric vehicles, guaranteeing that the pricing estimations are current and more accurate.
Adaptability in Real Time:
AI’s real-time adaptability is one of its main advantages when it comes to estimating automotive prices. AI models are continuously learning from fresh data inputs, in contrast to traditional approaches, which frequently rely on static data or out-of-date information. For example, AI can swiftly adjust its forecasts to account for unexpected changes in the economy, such as a spike in gasoline costs or a change in the tastes of automobile buyers.
No matter how rapidly the market changes, this flexibility guarantees that automobile price projections are always accurate. This provides consumers and businesses an advantage in a market that moves quickly by maintaining current and accurate pricing projections.
Deep Perspectives:
Compared to conventional techniques, AI models may provide a far more thorough and in-depth understanding of the various aspects that influence auto costs. For instance, AI may consider the car’s color, the number of prior owners, and even its accident history in addition to the vehicle’s age and mileage. AI can produce a more accurate and nuanced image of an automobile’s actual market worth by taking into account a wide range of factors.
Car dealerships used car sellers, and everyone else attempting to determine the true value of a vehicle may find this especially useful. Better decision-making and a more precise grasp of automotive values result from the capacity to view pricing more holistically.
Challenges and Limitations of AI Predictive Models
Despite their amazing potential, AI predictive models have many downsides and obstacles. The availability and quality of data is one major problem. For AI models to learn and generate accurate predictions, they mainly rely on large, high-quality datasets.
Nevertheless, it can be challenging to get clear, thorough data. Unreliable results can be produced by models that are flawed due to incomplete or biassed data. Building models that accurately represent real-world conditions is particularly difficult in industries where data is sensitive or hard to come by.
The amount of data that is available for training AI models is limited in many industries by data that is either proprietary or hard to access. For instance, privacy laws protect highly sensitive healthcare data and may limit the availability and sharing of patient information.
It is difficult to develop models that can precisely forecast outcomes or diagnose conditions due to the lack of data. Furthermore, data may be plentiful but biased in domains like finance or law enforcement, reflecting past injustices and possibly causing skewed predictions if not appropriately addressed.
Moreover, even in cases where data is accessible, its efficient utilization frequently necessitates thorough cleansing and preprocessing. Because real-world data is unstructured, it may include mistakes, missing values, or inconsistencies that require correction.
In order to guarantee that the data is correct and pertinent, this preprocessing step is important but time-consuming and requires domain expertise. Any mistakes made during this process could lead to models that are less reliable and more prone to mistakes. It is imperative to tackle the issues of data quality and availability to create AI models that are trustworthy, equitable, and accurately represent the environments in which they are used.
AI and Machine Learning for Sales:
The Key to Unlocking Growth Potential
The development of artificial intelligence (AI) has significantly changed the sales industry, which has witnessed a remarkable evolution throughout time. The way companies approach sales processes and strategies has been completely transformed by AI. In this white paper, we will examine the concept of AI in sales, its historical evolution, and the advantages it provides for companies.

Use Case: Leveraging papAI Solution to build an AI Predictive Model to Estimate Car Prices.
Context
The “Vehicle Sales and Market Trends Dataset” provides a comprehensive collection of information pertaining to the sales transactions of various vehicles. This dataset encompasses details such as the year, make, model, trim, body type, transmission type, VIN (Vehicle Identification Number), state of registration, condition rating, odometer reading, exterior and interior colors, seller information, Manheim Market Report (MMR) values, selling prices, and sale dates. The selling prices are the target variable.
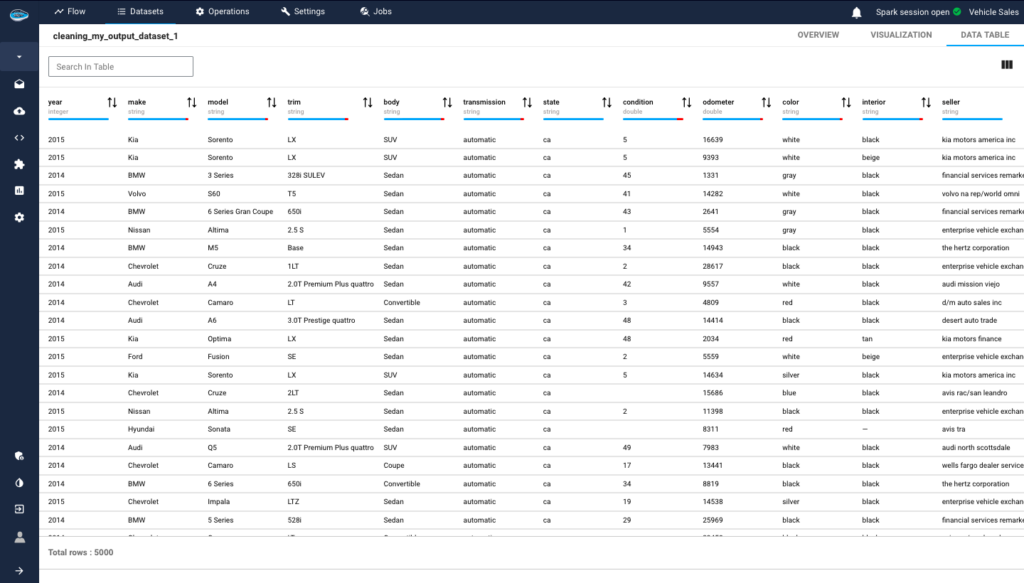
1- Data Exploration
papAI can compute automated statistics calculation, providing users with a detailed understanding of dataset characteristics. This feature computes various statistics for each variable. For numerical variables, it calculates the average value, standard deviation, minimum value, maximum value, and other metrics. For categorical variables, it identifies distinct categories and their frequencies, offering insights into the distribution of categorical data.
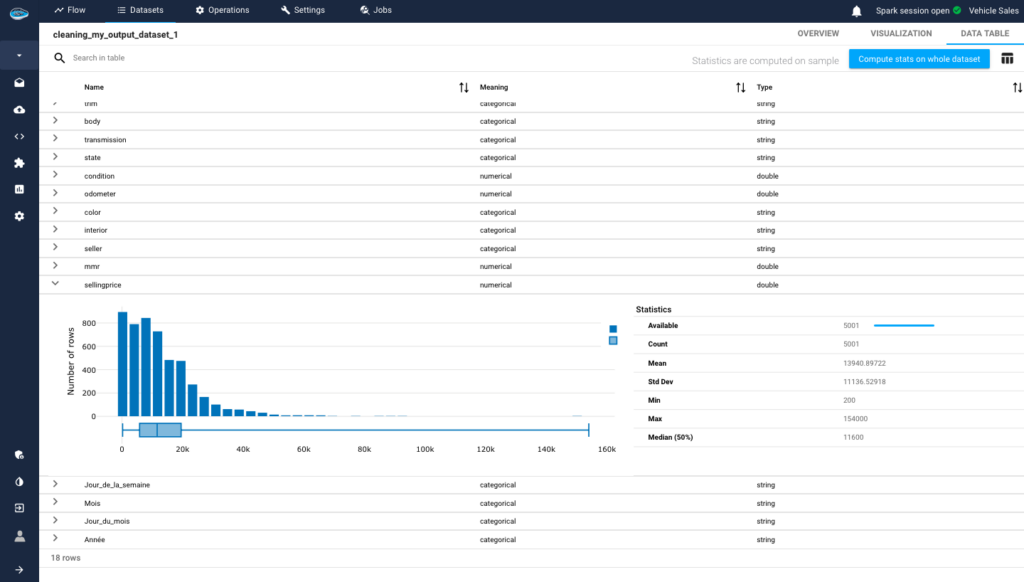
This analysis equips users with a thorough understanding of their data, facilitating informed decision-making and analysis.
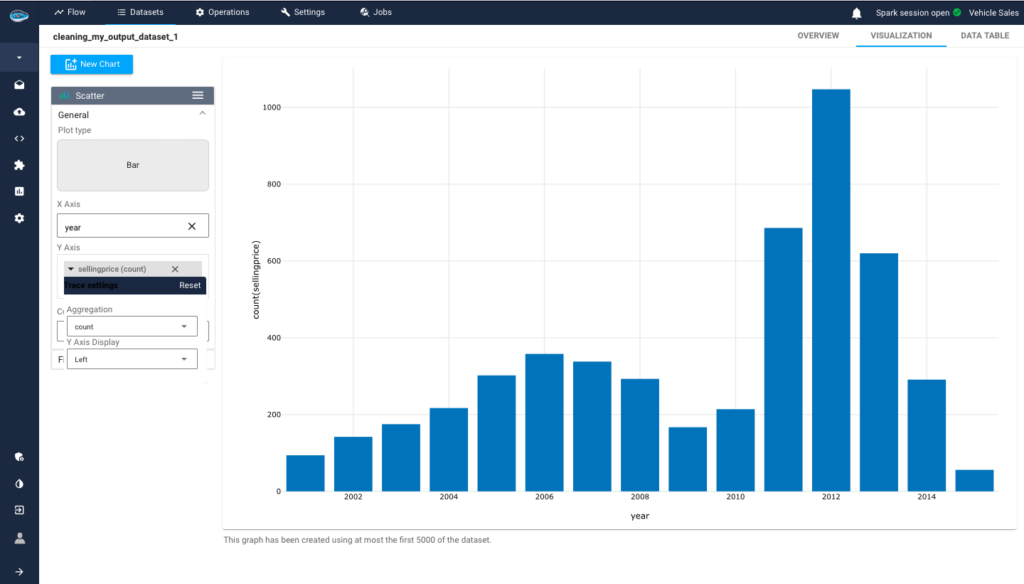
Thanks to papAI, we can observe the data and derive valuable insights from it. For example, we can analyze the distribution of car selling prices by year and see a peak in sales in 2012, possibly due to the economic recovery post-recession, favorable financing conditions, and high demand in emerging markets
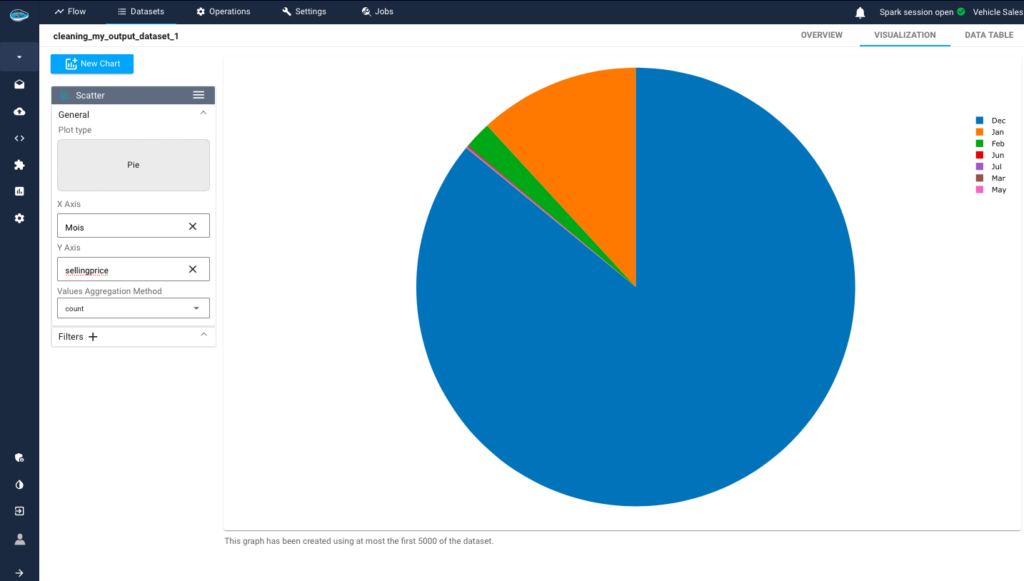
By analyzing the distribution of sales across months, it’s evident that December consistently records the highest car sales each year. This trend can be attributed to end-of-year promotions, the launch of new models, tax incentives, and consumers utilizing year-end bonuses.
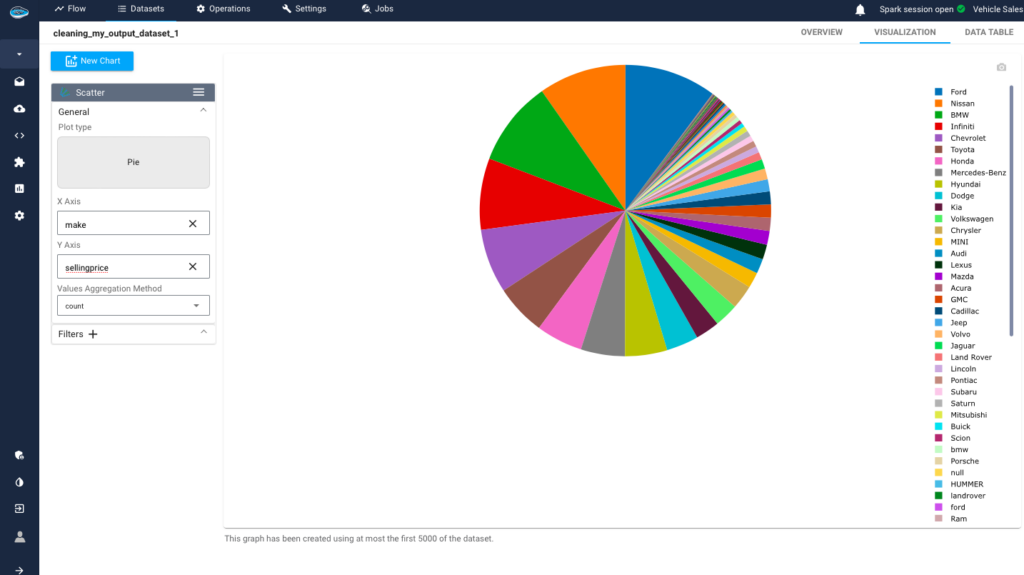
By examining two other distributions, one showing car prices by brand using the count aggregation, we observe that the most popular brands are Ford, Nissan, and BMW. These brands consistently lead in sales volume, reflecting their strong market presence and consumer appeal.
In contrast, the distribution using the average aggregation reveals the highest-priced cars, such as Ferrari and other luxury brands. This highlights the premium segment of the market, where vehicles command higher prices due to their exclusivity, advanced technology, and performance features.
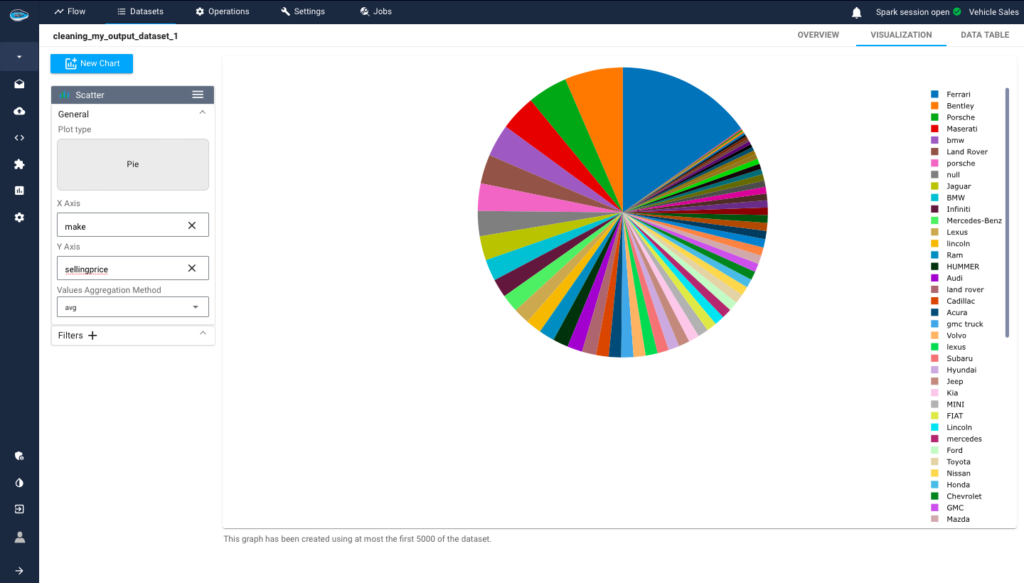
These analyses underscore the diversity within the automotive market, with brands like Ford and Nissan catering to a broad consumer base seeking reliability and affordability, while Ferrari and other luxury brands attract buyers looking for prestige and cutting-edge automotive engineering.
2- Preprocessing Data :
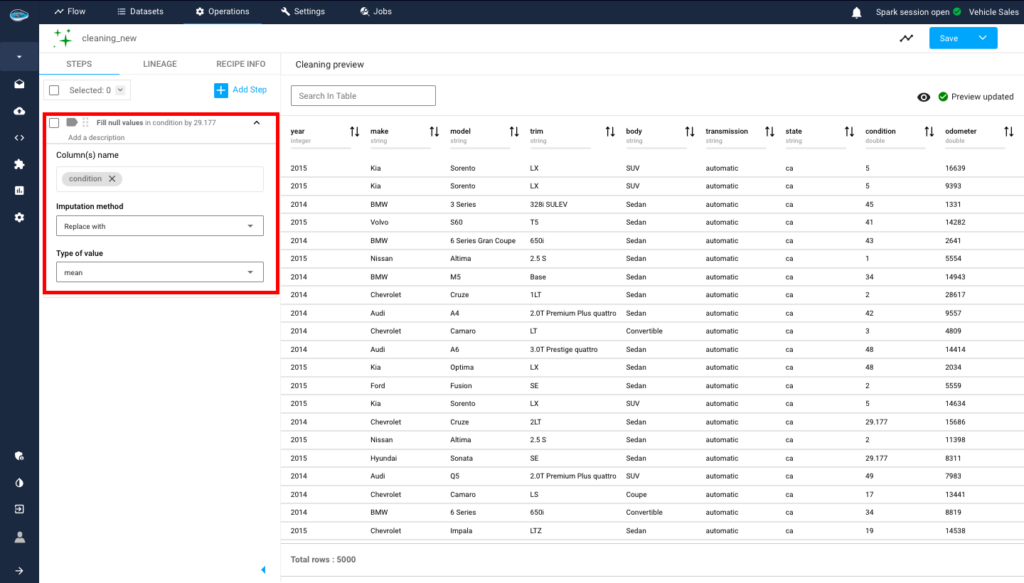
One of the important steps is preprocessing, where we clean our dataset to make it ready before building our model and starting the predictions. With the help of papAi, we can efficiently perform this preprocessing. For instance, we have the column “condition” which contains empty values. Using papAi, we can replace these null values with the mean of all the values in the column. This approach allows us to fill in the missing values without introducing random values that could skew our predictions.
Another useful cleaning operation involves removing the VIN (Vehicle Identification Number) column, which acts primarily as an identifier rather than influencing our analysis. This step helps streamline the dataset by focusing on more relevant attributes.

3- Building Model :
papAi offers all the necessary tools to proceed without needing to code the models. We simply need to select the ML task we want. In our case, since we want to predict the selling price of the cars, the most suitable approach would be to use regression.
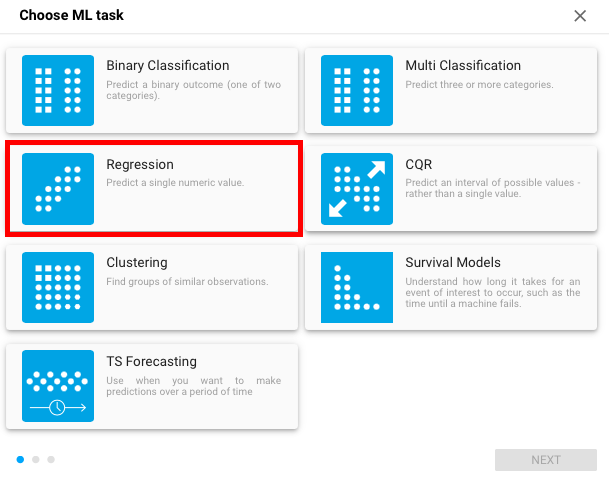
Next, we choose the algorithm or algorithms to use. papAi offers the most commonly used ones.

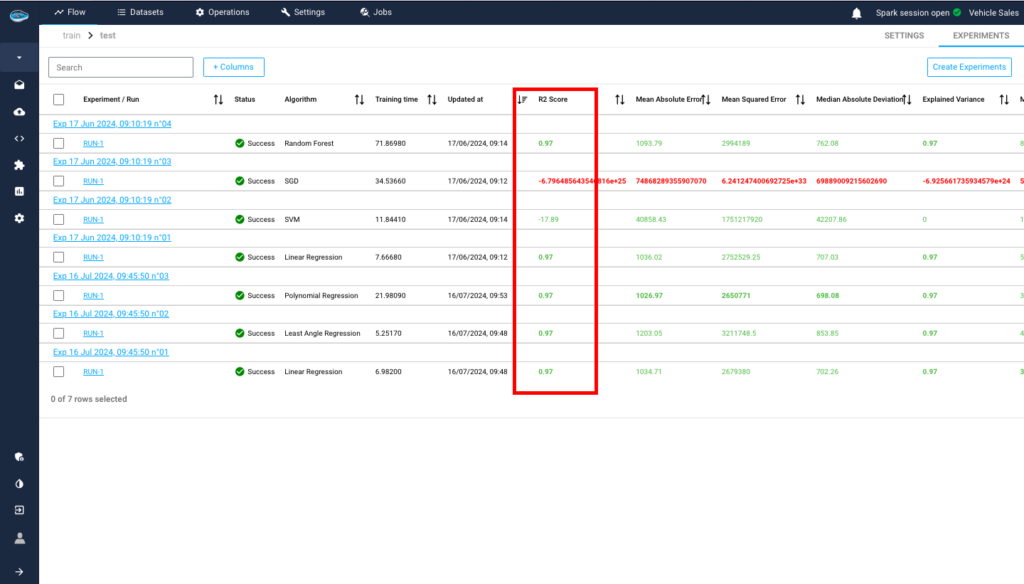
4- Model Evaluation and Interpretation:
Now that we have finished the training, we will have the results for each algorithm. We choose the one with the best results, here R2 score is the most important factor.
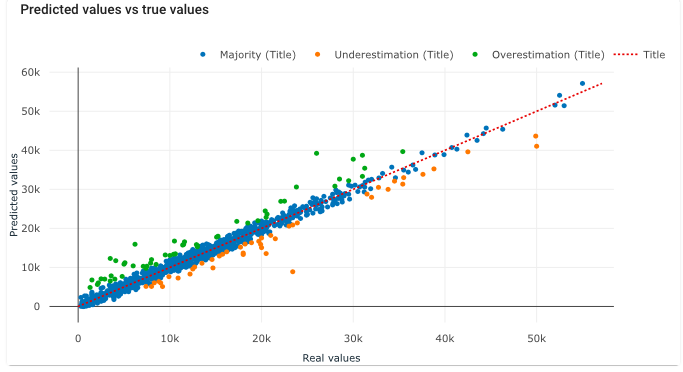
Now, we delve a bit deeper into our model. One crucial step in model validation is examining the relationship between predicted and actual values. When we plot the predicted values against the actual values, we observe that the data points align closely along the regression line, indicating a strong correlation and the model’s ability to accurately predict outcomes.
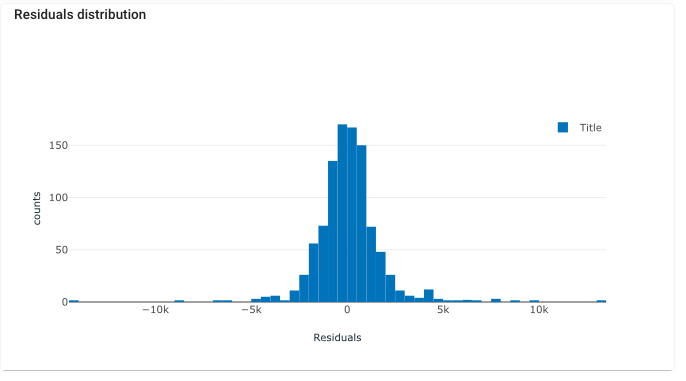
Furthermore, analyzing the distribution of residuals provides additional insights into the model’s performance. Residuals represent the difference between predicted and actual values for each data point. A key indicator of a well-fitted model is a normally distributed residual plot centered around zero. This distribution indicates that the model captures the variation in the data effectively, with no systematic errors or biases.
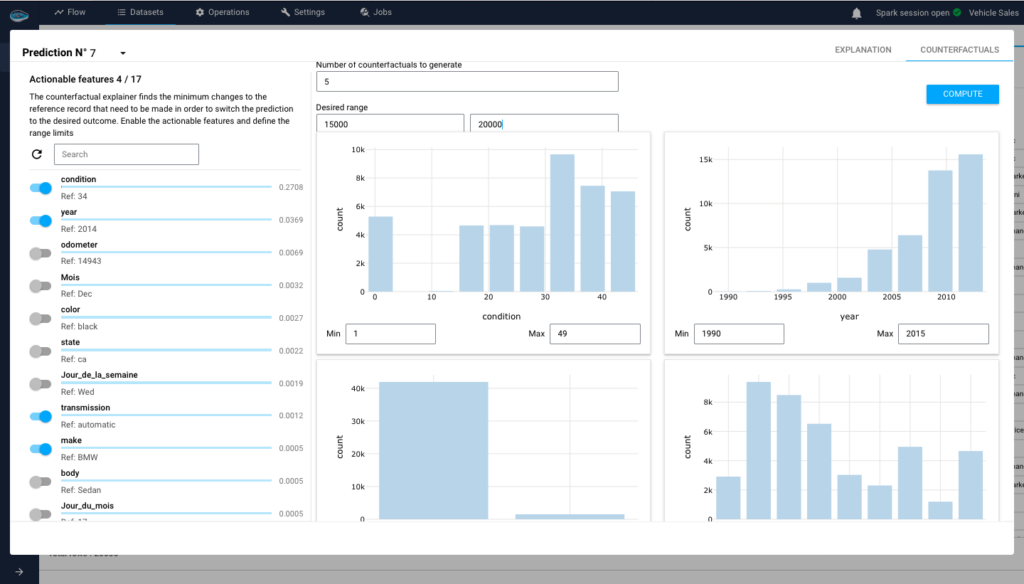
4-a) Counterfactuals :
The counterfactual explainer finds the minimum changes to the reference record that need to be made in order to switch the prediction to the desired outcome. Enable the actionable features and define the range limits
Finally, our analysis of automobile prices provides insightful information about consumer preferences and market trends. We are better able to comprehend the state of the automotive market by looking at price distribution and brand popularity in addition to using predictive modelling to make precise price estimates. These perceptions can help direct strategic pricing choices, strengthen market positioning, and eventually raise industry competitiveness.
Create your Own AI Predictive Model using papAI
Designed for ease of use without compromising on advanced capabilities, papAI enables businesses to develop custom predictive models tailored to their specific needs.
Whether you’re looking to forecast sales, optimize operations, or understand customer behavior, papAI offers an intuitive platform that makes AI accessible to everyone, from data scientists to business analysts.
Experience firsthand how papAI can transform your data strategy by booking a demo with one of Datategy’s AI experts today. Let us show you how easy and effective creating your own AI predictive model can be.
AI uses large datasets and advanced algorithms to consider various factors like age, mileage, make and model, market trends, and features (even details like color). This enables AI to make predictions much more accurately and quickly than traditional manual methods.
AI models are capable of processing and analyzing vast amounts of data in real-time, adapting to market changes. This continuous learning allows AI to improve its predictions over time, keeping car price estimates current with market conditions and emerging trends.
Common algorithms include linear regression for basic price predictions, decision trees and random forests for more detailed predictions, and deep learning models for handling complex, non-linear relationships in large datasets.
One of the main challenges is the availability and quality of data. AI relies on large, accurate datasets to make reliable predictions. Data may be incomplete, biased, or difficult to access, which can affect model accuracy. Additionally, preprocessing and cleaning data is a time-consuming and essential step.
Interested in discovering papAI?
Our AI expert team is at your disposal for any questions

How RAG Systems Improve Public Sector Management
How RAG Systems Improve Public Sector Management The most important...
Read More
Scaling RAG Systems in Financial Organizations
Scaling RAG Systems in Financial Organizations Artificial intelligence has emerged...
Read More
How AgenticAI is Transforming Sales and Marketing Strategies
How AgenticAI is Transforming Sales and Marketing Strategies Agentic AI...
Read MoreHow Do AI Predictive Models Estimate Car Prices?
Summary

Article Name
How Do AI Predictive Models Estimate Car Prices?
Description
Discover how AI predictive models use data and algorithms to estimate car prices with high accuracy and reliability.
Author
hocine ousmer
Publisher Name
Datategy
Publisher Logo