How Law Firms Use RAG to Boost Legal Research RAG...
Read MoreEnhancing Passenger Satisfaction:
AI-Driven Customer Satisfaction Predictions
Table of Contents
ToggleThanks to their simplicity and safety, airplanes have long been one of the top alternatives for those who want to travel. However, the civil aviation sector in several nations throughout the world has faced significant difficulties as a result of the onset of the new coronavirus epidemic in 2020. Airlines may enhance their services and gain an edge in challenging conditions and competitiveness by forecasting aircraft passenger satisfaction and identifying the key driving elements. A study by AltexSoft found that airlines that use AI to forecast passenger satisfaction are able to reduce customer churn by up to 20%.

Using machine learning algorithms to analyze data from past flights and find patterns related to improved passenger satisfaction is a method of anticipation. In this article, we will look at how to build a model from this data and apply it to predict passenger satisfaction.
Overview of AI Adoption in Airlines Industry
The global Artificial Intelligence in Aviation market size was valued at USD 686.4 million in 2022 and is expected to expand at a CAGR of 29.44% during the forecast period, reaching USD 2404.83 million by 2028. This growth can be attributed to a number of factors, including:
- The increasing adoption of AI by airlines to improve their operational efficiency and customer service.
- The growing demand for AI-powered solutions to improve safety and security in the aviation industry.
- The increasing investments in AI research and development by governments and private companies.
What AI Technologies are Used in the Airline Sector?
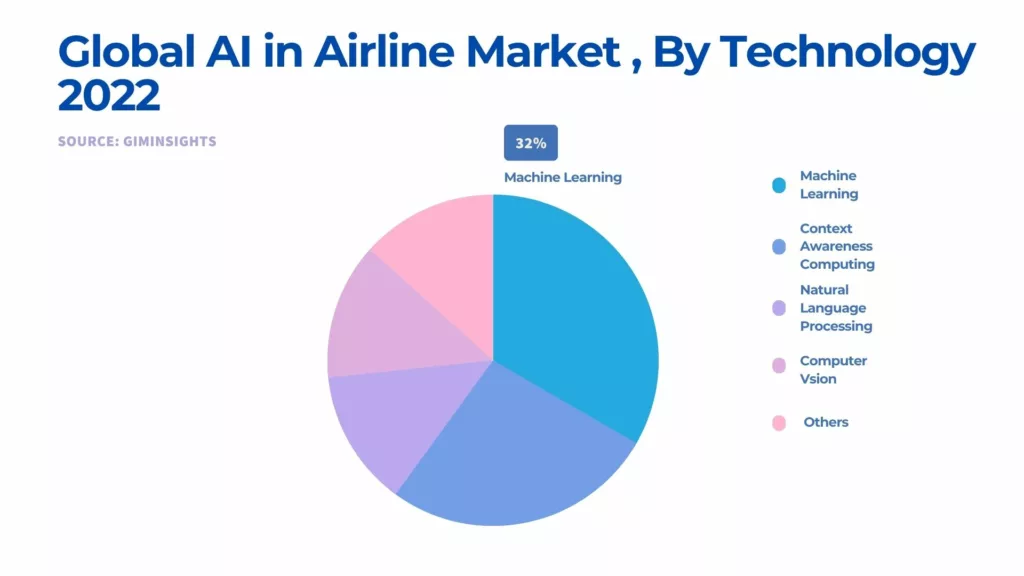
Due to its capacity to analyze sizable datasets and enhance decision-making, machine learning accounted for 32% of the Al in aviation market share in 2022. Machine learning models can improve predictive maintenance in the aviation industry by spotting equipment abnormalities, improving air traffic control, and fine-tuning crew scheduling. The technology’s flexibility enables it to draw lessons from past data and adjust to changing circumstances, improving aircraft performance, safety, and operational effectiveness
What are the Benefits of Passenger Satisfaction Forecasting for Airlines?
Better Service Quality: In order to increase passenger satisfaction via forecasting, a firm commitment to higher service quality is necessary. Airlines increasingly recognize how important it is to go above and beyond what customers anticipate. They make use of AI and predictive analytics to do this. Airlines get important insights into areas where service changes are required by analyzing a variety of data sources, including customer feedback, surveys, and reviews.
Airlines may proactively improve the quality and diversity of their culinary services, for instance, if data analysis frequently indicates customer unhappiness with in-flight food alternatives. This data-driven methodology guarantees that service improvements are accurate and in line with customer preferences. Airlines can offer a more nimble, responsive service that is tailored to each passenger’s preferences by anticipating problems before they arise, eventually improving service quality and providing a more positive travel experience.
Prevent Customer Churn: Building and maintaining client loyalty is the next stage for an airline after improving the quality of its services. Customers who are happy with their travel experience are more inclined to stick with one airline over another and make repeat purchases. The importance of predictive analytics in identifying the critical elements affecting customer loyalty cannot be overstated. Airlines can identify which features of their service have the most effect on consumers’ decisions to fly with a certain airline by examining historical data.
For instance, if customers frequently name timeliness as a key consideration when making a decision, the airline may concentrate on upholding punctuality and even use predictive maintenance to cut down on flight delays. Additionally, customized loyalty programs may be created, providing targeted benefits and prizes to regular travelers, encouraging them to keep traveling with that particular airline. By fostering brand loyalty and strong, long-lasting relationships with customers, these predictive metrics help the airline improve its market share and achieve greater customer retention rates.
Allocating Resources Effectively: The third element in improving passenger satisfaction for airlines is efficient resource allocation. Predictive analytics can help airlines allocate resources more effectively across all of their operational areas. Airlines, for instance, may precisely assign personnel, planes, and in-flight amenities to certain routes by examining past data and demand trends. With the correct degree of service for each flight and cost-effective operation, the airline is able to meet the expectations of its customers. Additionally, airlines are able to forecast changes in demand for certain routes, seasons, or times of day, which facilitates effective crew scheduling and enhances the travel experience for passengers. Because passengers are provided with the quality of service they anticipate thanks to this predictive resource allocation, customer satisfaction levels are greater and operating costs are reduced.
Case Study: Using papAI Solution to Forecast Passenger Satisfaction
In the ever-evolving landscape of air travel, gaining insights into the complexities of passenger satisfaction is crucial for airlines committed to enhancing the overall flight experience. The Flight Passenger Satisfaction dataset stands out as a rich source of information, delving profoundly into the multifaceted aspects that influence how passengers perceive their journeys.
The dataset unfolds like a panoramic view of the passenger journey, with each entry distinctly identified by key elements such as Gender, Customer Type, Age, Type of Travel, Class, and Flight Distance. These variables act as the threads weaving the narrative of satisfaction in the skies.
From the convenience of Inflight wifi service to the timeliness of Departure/Arrival, and the ease of Online booking, the journey through the dataset offers a granular perspective on the factors influencing satisfaction. Navigating through the Gate location, evaluating Food and drink quality, and gauging Seat comfort, insights emerge into the tangible aspects that contribute to passengers’ contentment.
But it doesn’t stop there—Online boarding, Inflight entertainment, On-board service, Leg room service, Baggage handling, Check-in service, Inflight Service, Cleanliness, and the crucial elements of Departure and Arrival Delays in Minutes paint a comprehensive picture of the entire travel experience.
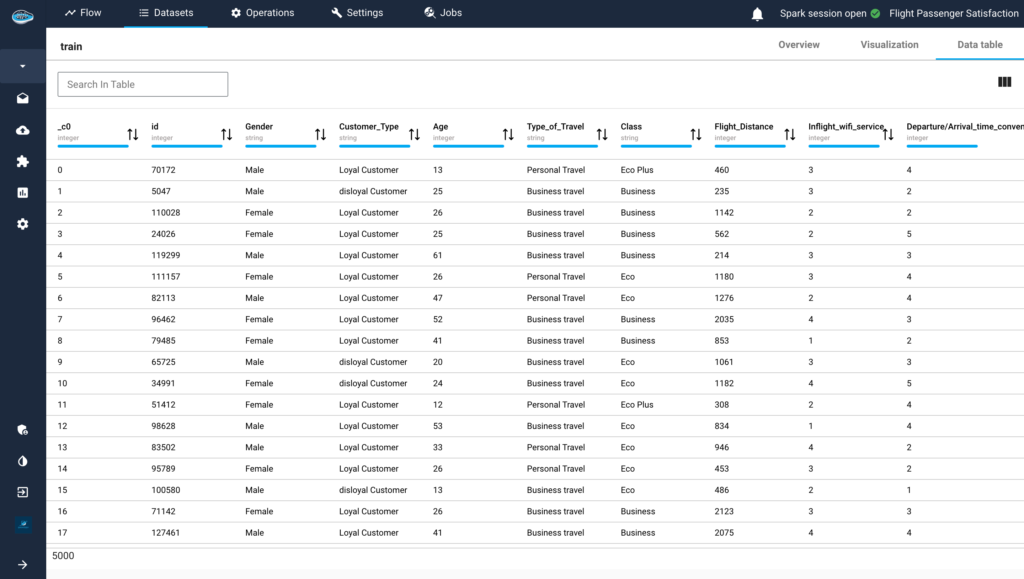
The dataset had been pre-divided into two sets for distinct purposes. The first set, comprised of 103,904 rows, was designated for training, while the second set, with 25,976 rows, was allocated for testing.
Leading the data revolution:
CDO role in today's organizations
The need for CDOs is expanding as a result of the growing significance of data in today’s corporate environment. Any organization’s success depends on the CDO, who is the primary force behind digital innovation and change.

1- Data Analysis and Preparation:
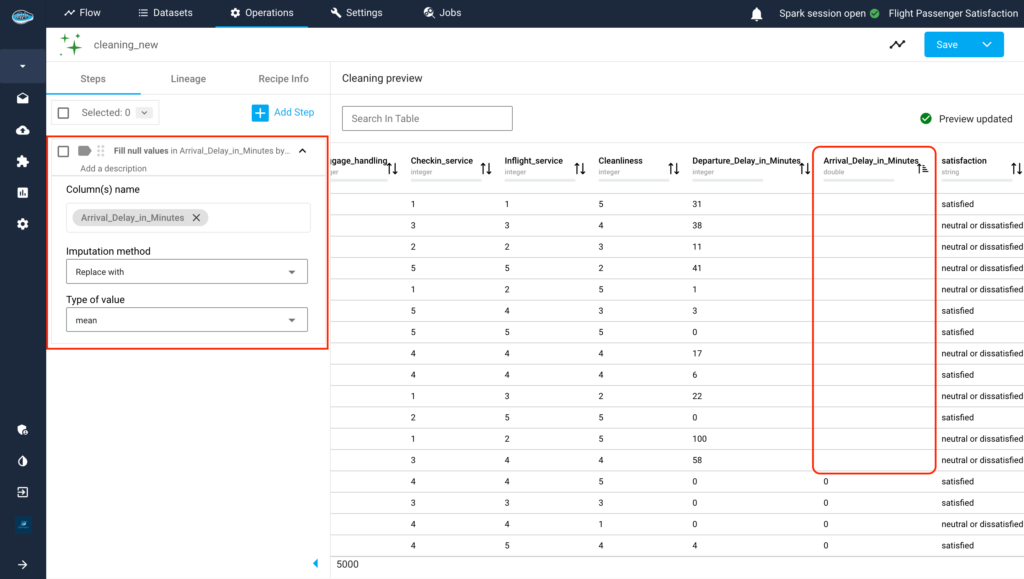
In the first phase, we examined the imported dataset and discovered that the “Arrival_Delay_in_minutes” column contained empty cells. To rectify this, we utilized papAI’s Cleaning feature ‘fill null values’ operation to replace the empty cells with the average of the existing values in the ‘Arrival_Delay_in_Minutes’ column.
papAI provides an extensive array of visualization tools, including bar plots and box plots. Let’s explore some visualizations related to passenger satisfaction based on age using bar plots and customer type based on flight distance with box plots.
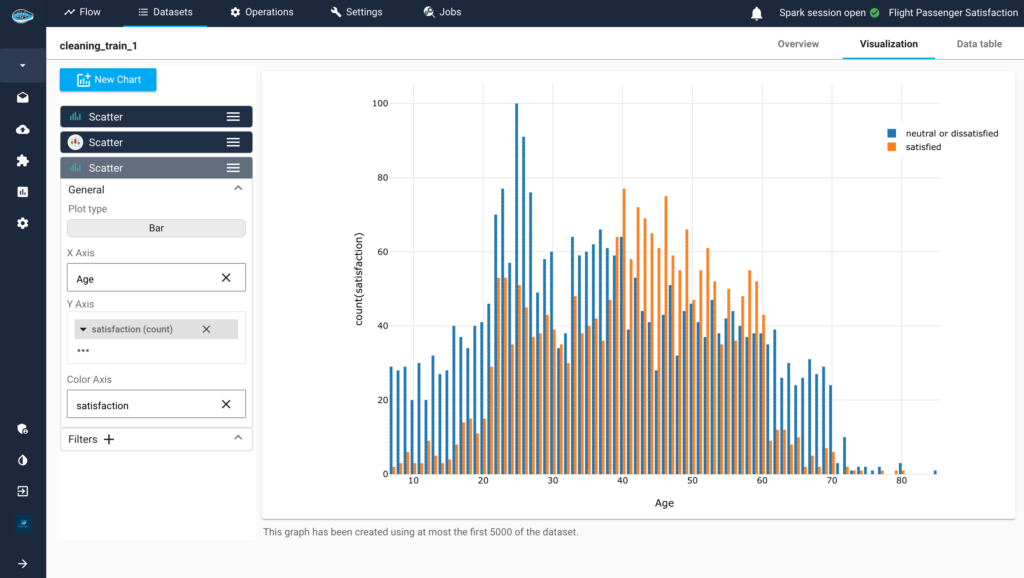
The bar plot graph showcasing passenger satisfaction based on age offers a compelling glimpse into the nuanced relationship between age groups and their overall contentment with flight experiences. Notably, the data reveals a distinct pattern where younger individuals tend to lean towards neutrality or dissatisfaction with their flights. This could be attributed to a variety of factors such as heightened expectations, specific preferences, or perhaps a lower tolerance for certain inconveniences during travel.
On the flip side, passengers aged between 40 and 60 emerge as a group more prone to satisfaction with their flights. This demographic trend may be indicative of a more seasoned and pragmatic approach to air travel, where individuals within this age bracket might have developed a clearer understanding of what to expect and have a greater ability to adapt to potential challenges during their journeys.
However, the overall results presented in the bar plot indicate a fairly well-balanced distribution of satisfaction levels across different age groups. Despite the pronounced differences between the younger and middle-aged demographics, the diversity in responses suggests that airlines are generally successful in catering to a broad spectrum of passengers, each with their unique expectations and preferences. This balanced outcome is indicative of the industry’s continuous efforts to enhance the overall satisfaction of a diverse passenger base.
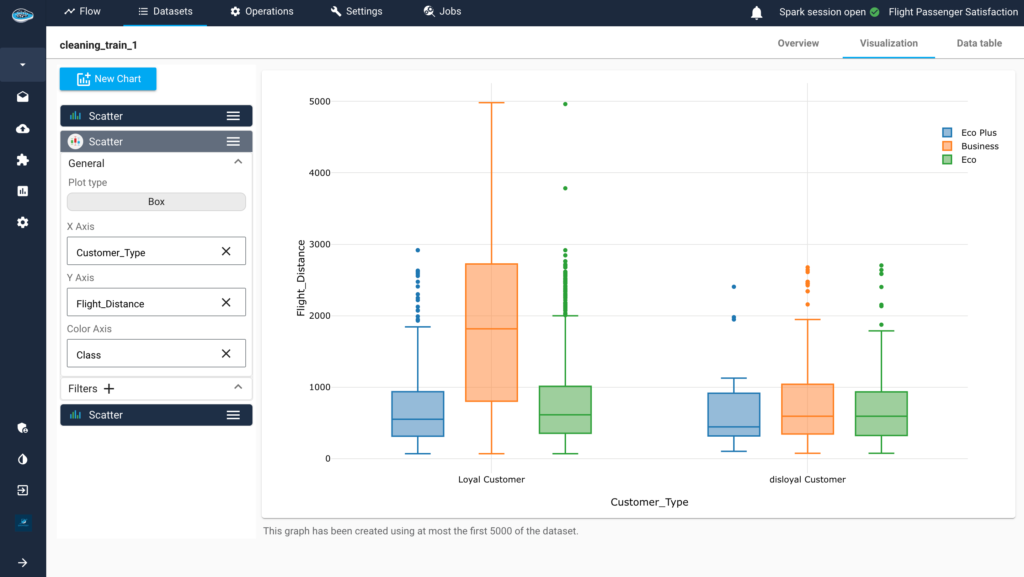
The box plot graph depicting flight distance based on customer type provides valuable insights into the travel patterns of passengers, particularly those classified as loyal customers. This visualization underscores a significant correlation between customer loyalty and the distance traveled, as well as the class of service chosen.
Focusing on the box plot related to loyal customers opting for Business class, a notable trend surfaces. A substantial portion of these dedicated travelers embarks on longer flights, as indicated by the extended whiskers and higher median distance. Approximately half of the loyal Business class passengers cover distances surpassing 1816 km—the median flight distance. This suggests a preference among loyal customers for more extensive journeys, potentially driven by business commitments, frequent travel habits, or a premium experience associated with Business class.
The dispersion of data within this box plot also reveals the diversity of loyal Business class travelers’ flight distances. Notably, some of these passengers venture close to the impressive 5000 km mark, highlighting a subgroup of customers who regularly undertake substantial journeys.
Overall, the box plot underscores the interconnected dynamics of loyalty, class choice, and travel distance. It suggests that a significant segment of loyal customers, particularly those opting for Business class, exhibits a preference for longer flights. Airlines can leverage this understanding to tailor services and amenities to the specific needs and expectations of this dedicated and high-value customer segment.
2- Data Training:
papAI’s Machine Learning Lab offers a wide range of pre-built machine learning algorithms and model selection tools. Choosing the right algorithm is essential for accurate passenger classification. You can experiment with various algorithms such as Logistic Regression, Random Forest, Gradient Boosting, Neural Networks.
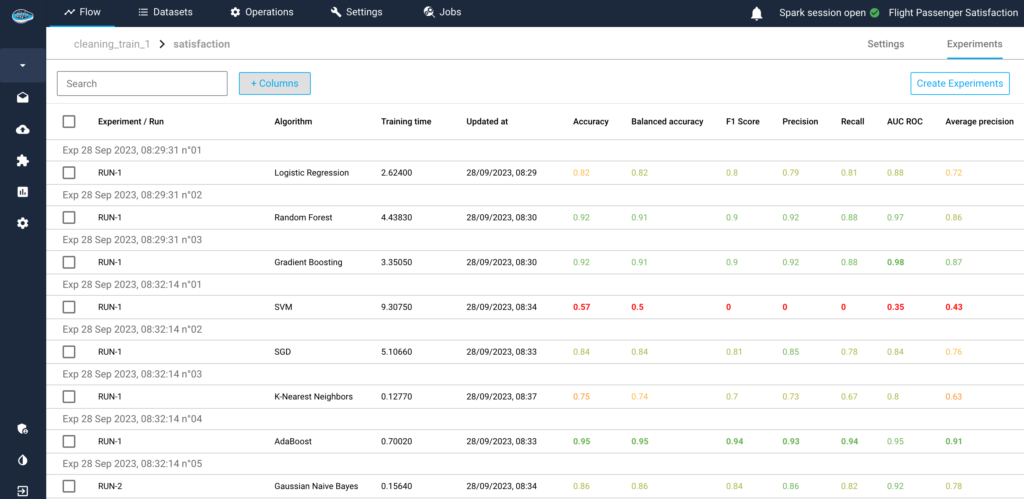
papAI offers an interface that is easy for users to navigate and compare the performance of these models through metrics such as accuracy, precision, recall, and ROC curves. This iterative approach guarantees the selection of the most suitable model. After deciding on a model, papAI streamlines the training process, allowing users to specify hyperparameters and train the model with minimal effort through a few clicks. Additionally, the platform supports automated hyperparameter tuning to refine your model for optimal performance.
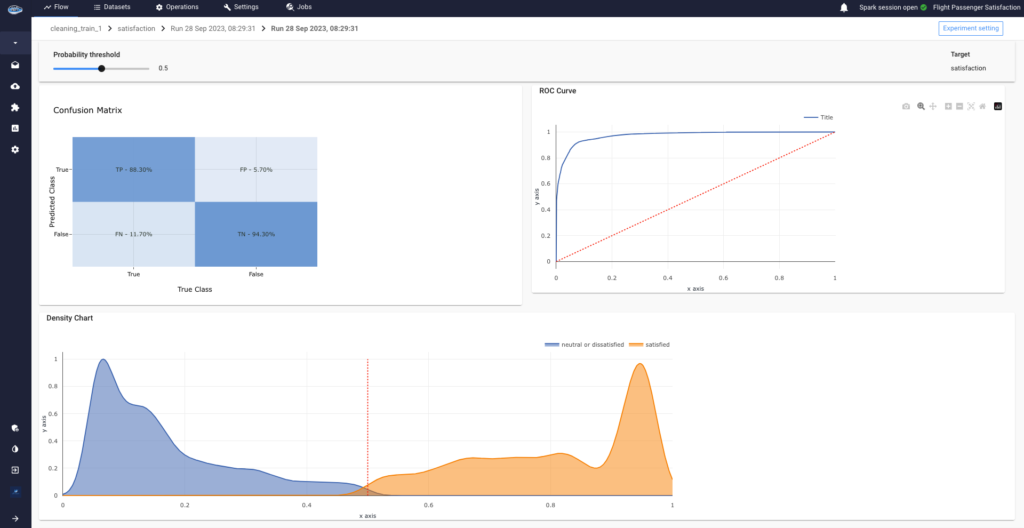
Upon completing the training of your model, it becomes crucial to conduct a thorough evaluation of its performance. Within papAI’s Machine Learning Lab, you gain access to comprehensive model evaluation reports, encompassing elements like confusion matrices, precision-recall curves, and feature importance scores. These insights serve as valuable tools for assessing the effectiveness of your model in accurately classifying passenger satisfaction.
The confusion matrix, with values such as True Positive (88.30%), False Negative (5.70%), False Positive (11.7%), and True Negative (94.3%), succinctly outlines the model’s accuracy in classifying passenger satisfaction. It serves as a concise yet comprehensive tool, offering insights into the model’s ability to correctly identify positive and negative instances. This information is instrumental in evaluating the model’s overall performance and refining its predictive capabilities for enhanced passenger satisfaction classification.
The Receiver Operating Characteristic (ROC) curve is a graphical representation that illustrates the trade-off between the true positive rate (sensitivity) and false positive rate (specificity) across various threshold values. Essentially, it provides a visual assessment of a model’s ability to distinguish between classes. In the context of passenger satisfaction classification, the ROC curve can be interpreted as a measure of the model’s performance in correctly identifying satisfied passengers while minimizing the misclassification of dissatisfied passengers.
3- Interpretability & Explainability:
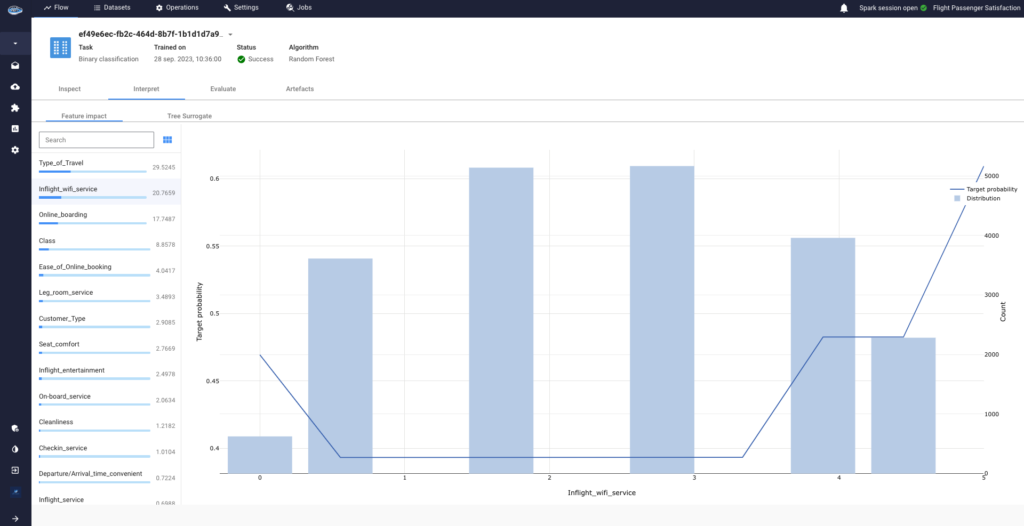
In the realm of flight passenger satisfaction analysis, feature importance, counterfactuals, and explanations play pivotal roles in model interpretation and comprehension. Feature importance involves assessing the impact of various factors like ‘Inflight wifi service,’ ‘Seat comfort,’ and ‘Online boarding’ on the model’s predictions, helping identify key drivers influencing overall satisfaction levels.
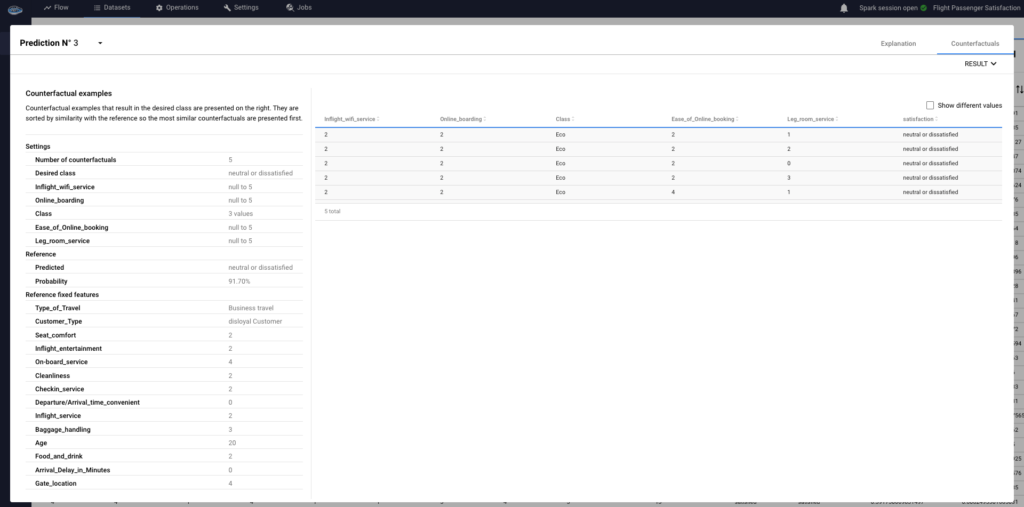
A-Counterfactual
Counterfactuals offer insights into hypothetical scenarios, allowing exploration of how adjustments to factors such as ‘Inflight Entertainment’ or ‘Food and Drink’ could alter predicted satisfaction levels for specific passengers.
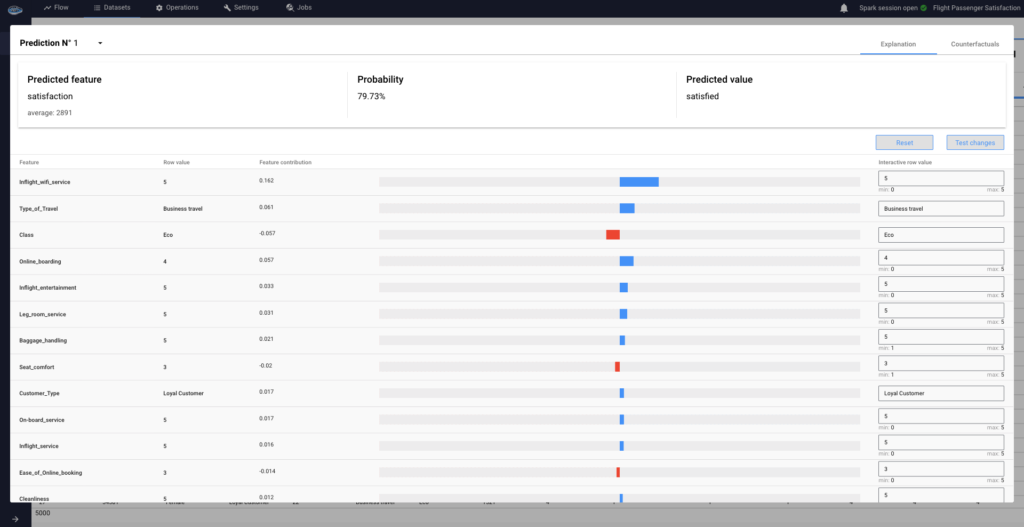
B- Explainability
Explanation techniques shed light on the model’s decision-making process, revealing why certain satisfaction levels are predicted based on the intricate interplay of features. This interpretability is vital for fostering trust in the model’s predictions and uncovering actionable insights to enhance the flight passenger experience.
Build Your AI-Driven Customer Satisfaction with papAI Platform
Average result achieved with papAI solution
Utilize the features of papAI platform to fully utilize AI’s potential for raising customer satisfaction. Create a unique AI-driven solution that is tailored to your unique requirements and uses cutting-edge machine learning methods to increase forecast accuracy and operational efficiency.
papAI accelerates the deployment of AI projects by streamlining data mining, cleansing, and visualization. Don’t miss the chance; book your demo right now, and our team of professionals will help you build a customized AI solution that perfectly matches your objectives for customer pleasure.
Interested in discovering papAI
Our team of AI experts will be happy to answer any questions you may have.
How RAG Systems Improve Public Sector Management
How RAG Systems Improve Public Sector Management The most important...
Read MoreScaling RAG Systems in Financial Organizations
Scaling RAG Systems in Financial Organizations Artificial intelligence has emerged...
Read MoreHow AgenticAI is Transforming Sales and Marketing Strategies
How AgenticAI is Transforming Sales and Marketing Strategies Agentic AI...
Read More
